
Know the number. Know why.
Forecasts built from live pipeline, stage probabilities and past results, with a dashboard for each role and reports that open to the deals behind them.

The quarter, before it ends.
Combine live pipeline, stage probabilities and what each owner has won before.
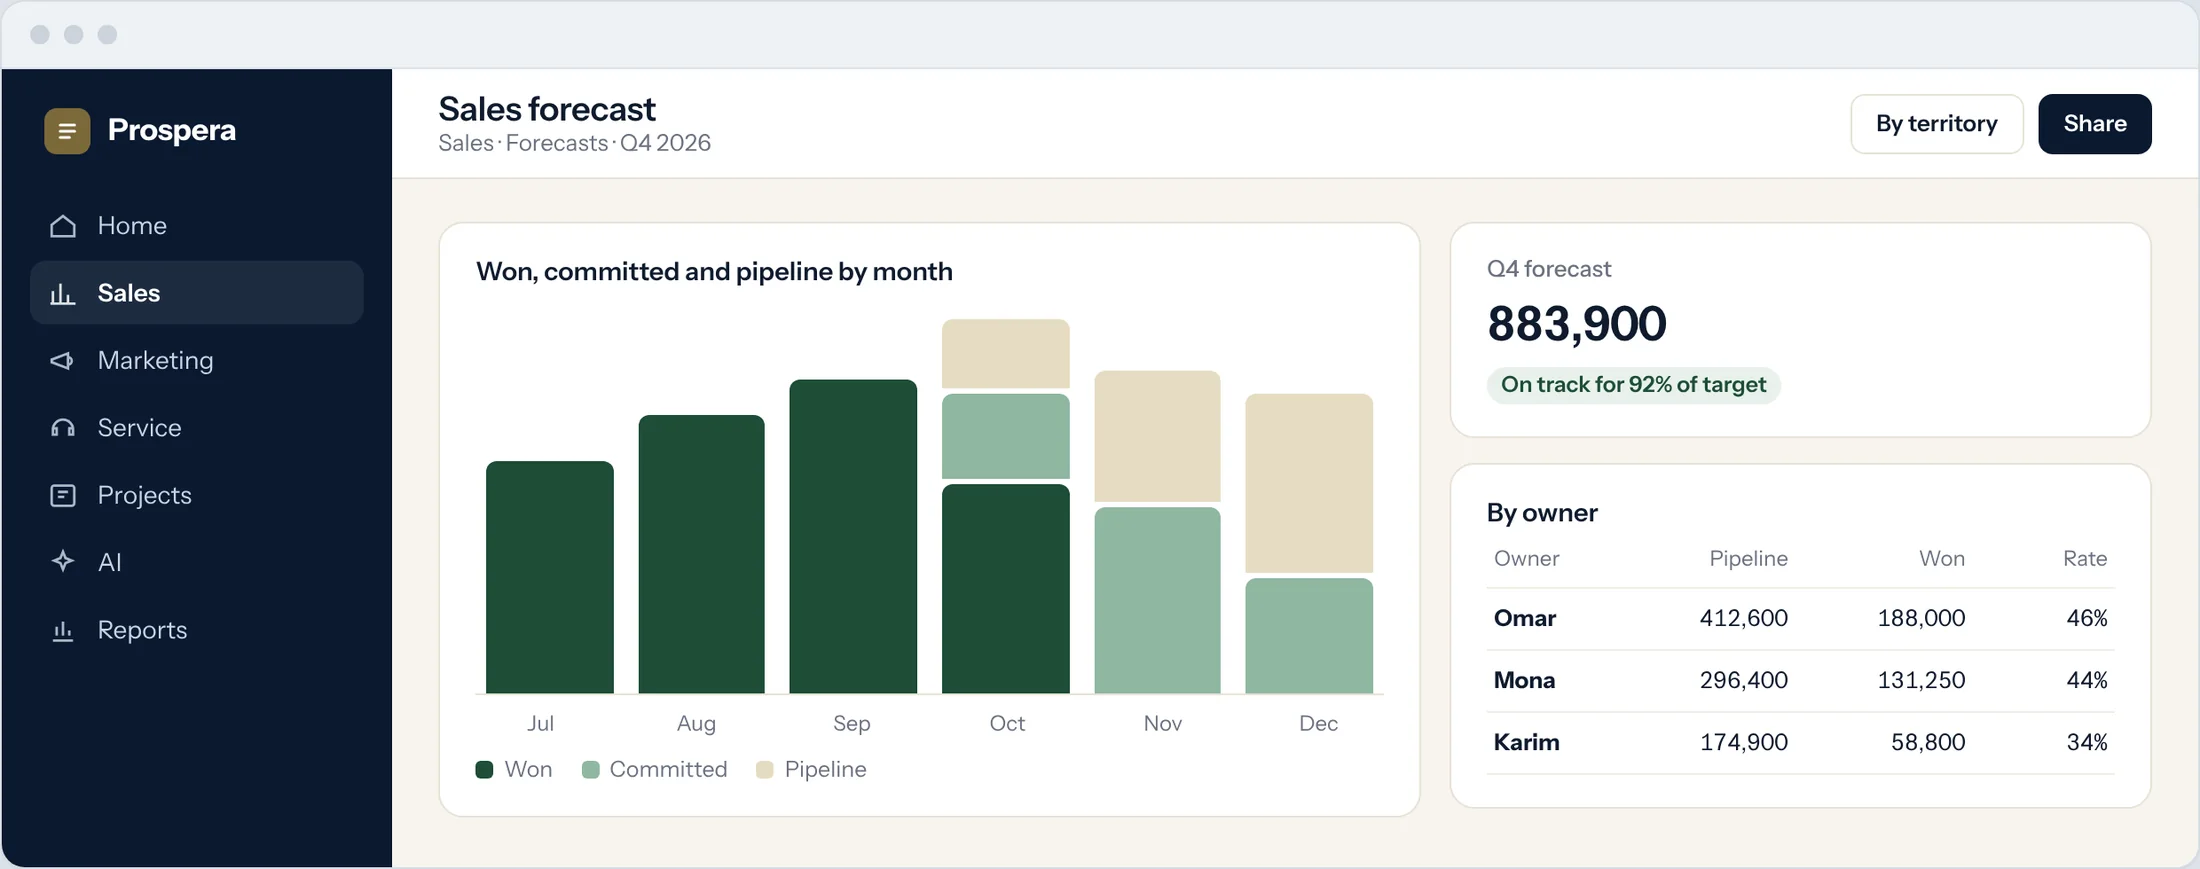
Won, committed, pipeline
Month by month for the quarter.
By owner and territory
See who is on track and where the gaps are.
Always current
Updates as deals move.
A dashboard for every role.
Each role gets a focused view of the numbers, alerts and work that matter to them.
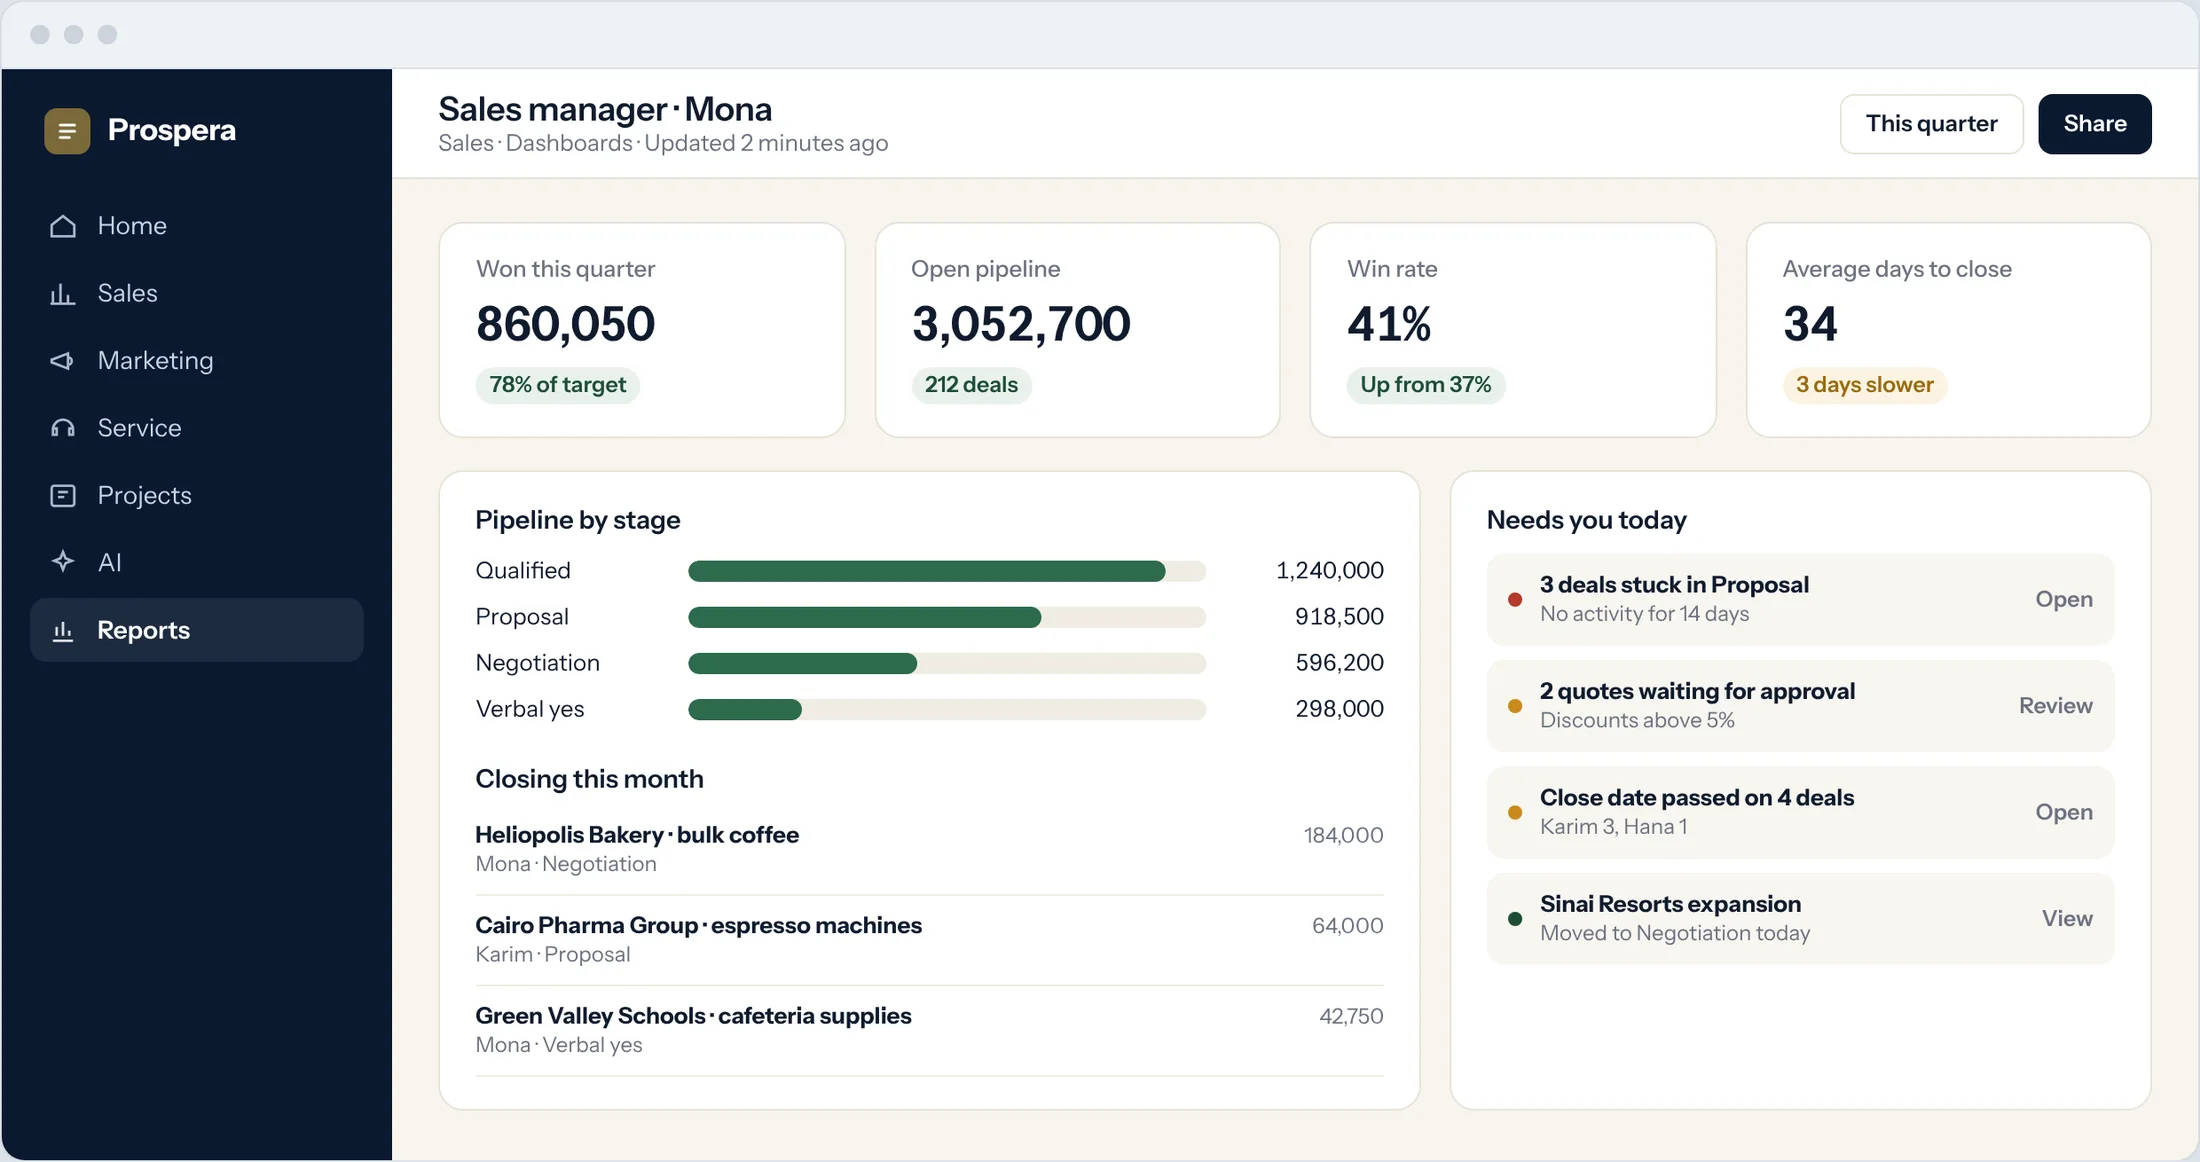
What needs you today
Stuck deals, approvals and missed close dates.
Pipeline by stage
Where the value sits and where it stalls.
Against target
Won, win rate and days to close.
Ask the question. Get the answer.
Build real-time reports across pipeline, activities, conversion and team performance, and open any number to the deals behind it.
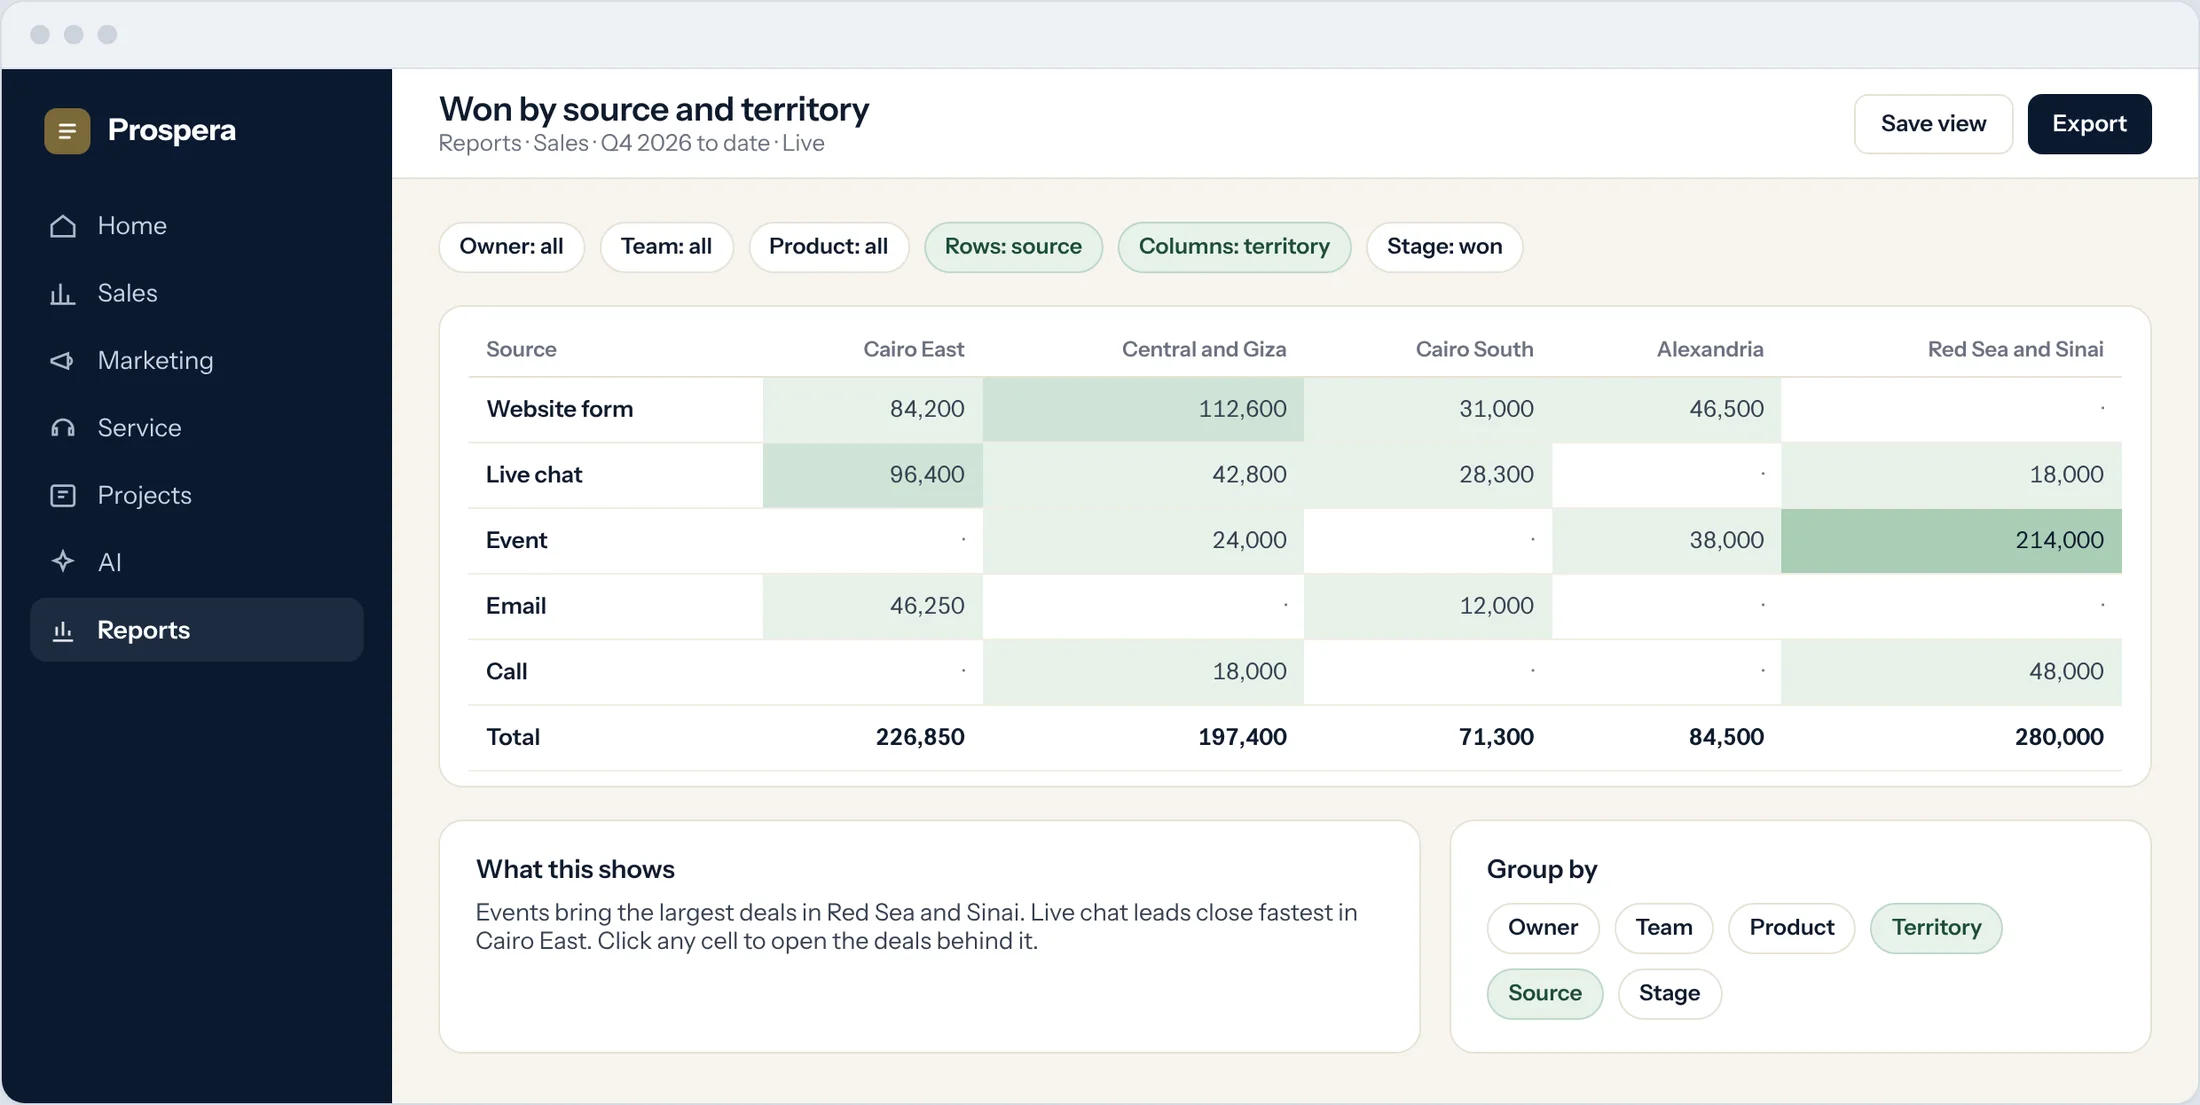
Any grouping
Owner, team, product, territory, source or stage.
Drill down
Click a number to see the deals behind it.
Save and share
Save a view and share it with your team.
Numbers you can act on.
Six details that keep managers ahead.
Real time
Reports read live data, not last night's copy.
By owner and team
Compare people and teams fairly.
By territory
See each area against its target.
By source
Know which channels bring deals that win.
Permissions by role
Each person sees the numbers their role allows.
Paid, from the books
Payment status comes back from Prospera Books.
Questions.
How is the forecast calculated?
From your live pipeline, the probability of each stage and each owner's past results.
Can each person have their own dashboard?
Yes. Dashboards are set by role, so a manager, a salesperson and a director each see what matters to them.
Can we report by territory and source?
Yes. Reports can be grouped by owner, team, product, territory, source or stage.
Are the reports current?
Yes. Reports and dashboards read live data and update as deals move.
Run sales on facts.
Book a demo and we will build your dashboards with you.